
Table of Contents
Site slow? Is your hosting acting up? Is the caching broken? Diagnosing site performance is tricky. A slow website can negatively impact user experience, resulting in lost traffic, lost revenue, and lost SEO rankings. Put an end to that and investigate like a pro!
General Scenario
In order to improve website performance, it’s important to identify and fix such issues quickly. This is where tools like Code Profiler and New Relic come into play.
If you’re familiar with New Relic, you may be aware of how powerful it is in breaking down hangups and long running processes in your sites code. But if you don’t have the budget for such a high quality service, then check out this new alternative called Code Profiler!
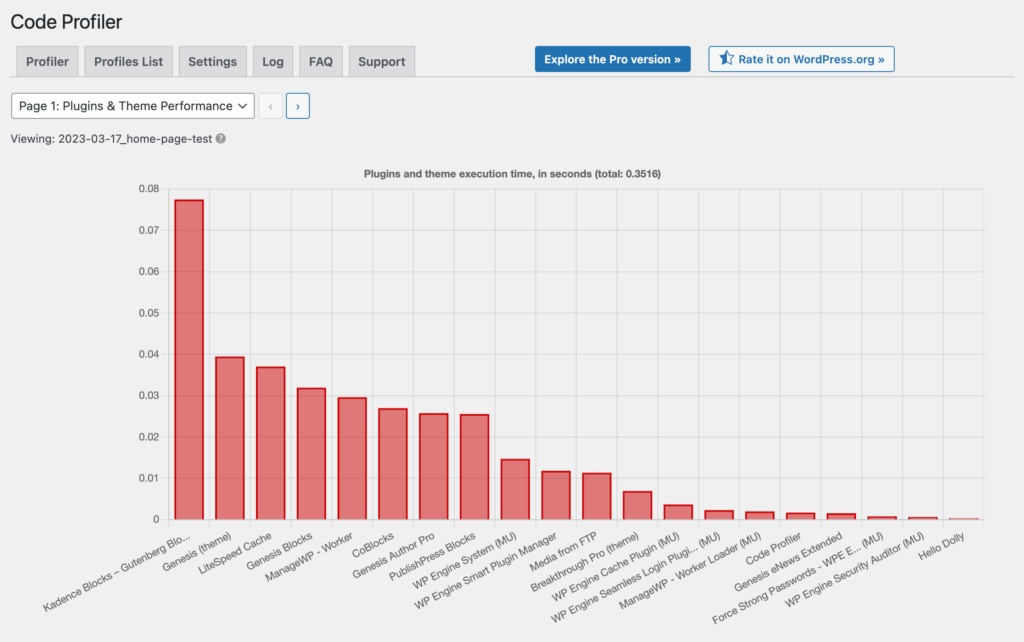
While the output in the free version is no where near as robust as NewRelic, it does still at least identify what plugins are contributing to the slow load times.
Diagnosing Methods
Code Profiler analyzes the your website by tracking the execution time and memory usage of PHP functions and MySQL queries. It generates reports and graphs that help you identify bottlenecks in your plugin stack.
New Relic is a cloud-based platform that provides real-time monitoring for web applications. It offers features such as transaction tracing, error detection, and APM (application performance monitoring).
While both Code Profiler and New Relic can help you improve the efficency of your website, they have some key differences.
Ease of use
Code Profiler is a plugin that can be easily installed and used within WordPress. It doesn’t require any additional configuration or setup. New Relic, on the other hand, requires more setup and configuration as it’s a cloud-based platform. However, once it’s set up, New Relic provides more comprehensive monitoring.
Performance data
Code Profiler Pro provides detailed information on PHP functions and MySQL queries. This makes it easy to identify which specific code is causing issues. The free version of Code Profiler will show a chart of all plugins running on a given page, and list them in order of most processing time.
New Relic, on the other hand, provides a more comprehensive view of your website’s performance. It tracks server response time, throughput, error rates, and more. This makes it easy to identify not only code-related issues but also issues related to infrastructure and other external factors.
What’s the cost
Code Profiler is a free plugin, with an option to upgrade to a Pro license for $59 per year. New Relic is a paid service and offers a free trial, but after that, their pricing structure is based on usage, and could cost hundreds to even thousands of dollars per month. If you’re on a budget, Code Profiler may be a good option for you. However, if you’re running a large website or application, the additional features provided by New Relic may be worth the investment.
Conclusion
In conclusion, both Code Profiler and New Relic are valuable performance monitoring tools. Code Profiler is a good option for smaller websites or those on a budget. It’s easy to use and the Pro version provides good information on PHP functions and MySQL queries. New Relic, on the other hand, is a more comprehensive platform that offers real-time monitoring of web applications. It’s a good option for larger websites or applications that require more in-depth monitoring and analysis. Ultimately, the choice between these two tools depends on your specific needs and budget.
-Anthony
And if you’re already optimizing your site with caching, the checkout these protips on how to avoid caching interfering with your development.

I was inspired to write this blog entry after seeing this post on reddit.
I hope this information is clear and helpful. Please don’t hesitate to let me know if you have any questions, concerns or new info I should add to this post. Simply leave a comment below or hit me up on Twitter.
Note, approximately 80% of this blog post was written by ChatGPT.
Leave a Reply